What is my fat mass percentage?
Each person that invests certain amount of time in training probably asked himself “what is my fat mass percentage?”. So far, I have participated in numerous measurements of body composition with both professional and recreational athletes and interestingly every participant is always excited about seeing those results. In the world of fitness it always feels good expressing results numerically because that gives realistic insight into current state of fitness.
When speaking of health related values they are 10-25% of fat mass in men and 18-30% in women. (2, 3) Excessive fat mass not only leaves a bad impression and can lead to grave illness but also negatively affects self-confidence.
Numerous studies have determined that excessive abdominal fat mass is related to:
- high blood pressure
- metabolic syndrome
- diabetes mellitus type 2
- diseases of arteries
- hyperlipidemia
- 8 types of cancer and more
In contrast to excessive fat mass, malnutrition also poses an immediate threat. Physical health of whole body and reproductive system are negatively affected. (5) Certain amount of fat is essential and can be found in neural tissue, bone marrow and internal organs. It is estimated at 3% of body mass for men and 12% for women. (6)
MEASUREMENT OF FAT MASS PERCENTAGE
Now that we know the importance of body composition next task is finding out how should it be measured.
There are several commonly used methods for determining body composition and some of them are:
- anthropometric characteristics and skinfold thickness
- bioelectrical impedance
- dual-energy X-ray absorptiometry (DEXA)
- hydrostatic underwater weighing
Anthropometric characteristics
BMI
Body mass index (BMI) is one of the most commonly used methods that is supposed to give insight into body composition. BMI represents relation between kilograms and height, is calculated as a ratio between squared body mass and height and expressed in squared meters.
Depending on the result, participant is put into one of the 6 categories shown in Figure 1. The goal is to be in the category “normal weight” which ranges from 18,5-24,9 and represents ideal body weight. Category that ranges from 25-29,9 is overweight, 30-34,9 is 1st degree obesity, 35-39,9 is 2nd degree obesity and >40 is 3rd degree obesity. Values lower that 18,5 are underweight.
Figure 1. Body mass index categories
| Values | Category |
| < 18,5 | Underweight |
| 18,5-24,9 | Normal weight |
| 25,0-29,9 | Overweight |
| 30,0-34,9 | Obesity I |
| 35-39,9 | Obesity II |
| > 40,0 | Obesity III |
Aldo BMI sometimes can be useful parameter it should not be used because it treats body weight as a number and not as a relation between fat and fat free mass.
Example:
Two brothers Bero and Pero have the same height of 180cm and weight 100kg.
Bero is truly in love with weightlifting and he has only 10% fat mass.
Pero is 180cm tall, weighs 100kg, hates exercise but loves playing computer games. His favorite game is Sims 3D. Unlike Bero, Pero has 30% fat mass.
When we calculated BMI for Bero we got: 100/3.24=30,8
When we calculated BMI for Pero we got: 100/3=30,8
As demonstrated, BMI puts both in the same category of being obese albeit everyone sees that Bero who has 10% fat mass also has bigger amount of fat free mass that Pero.
BMI can often be misleading. Still it is correlated to hypertension and total cholesterol in participants that are >30,0. When it comes to sedentary population it can be said that high BMI point to high fat mass. When it comes to well trained population other methods for estimating fat mass percentage should be used.
WAIST CIRCUMFERENCE
Waist to hips ratio (WHR) is commonly used along with BMI. Two measures are taken: waist and hips circumference. Ratio tells us more about mass distribution. People who have more abdominal subcutaneous fatty tissue are under higher risk of all afore mentioned diseases. There are also two types of fat mass distribution. Women usually have gynoid type of distribution characterized by having more fat around hips while men have android type with more abdominal fat.
Waist circumference is measured by putting measuring tape on the tightest part of the body between lower ribs and umbilicus. Hips circumference is measured on the widest part of gluteal region. Measurement should be done in knickers. Afterwards obtaining both values they should be divided by each other.
Example:
Bero:
Waist circumference – 88cm
Hips circumference – 100cm
88/100 = 0,88 à Which puts it in the category “Good”.
Pero:
Waist circumference – 110cm
Hips circumference – 95cm
110/95 = 1,15 à Which puts it in the category “High Risk”.
Figure 2. WHR categories
| Waist to hips ratio (WHR) | ||
| Men | Women | |
| Excellent | <0,85 | <0,75 |
| Good | 0,85-0,89 | 0,75-0,79 |
| Average | 0,90-0,94 | 0,8-0,85 |
| High risk | >0,95 | >0,85 |
Along with WHR, waist circumference alone can be a good indicator. Men are under high risk when waist circumference exceeds 102cm and low risk when under 80cm. Women are at high risk when waist circumference exceeds 88cm and low risk when 70cm or less.
Bioelectrical impedance – BIA
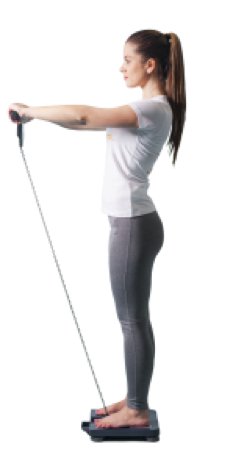
Analysis of body composition using bioelectrical impedance estimates total body water, fat free mass and fat mass by measuring resistance to the flow of electrical current through the body. The participant does not sense the electrical current that is released from the device and moves through the body. Quantity of water in the body can be a confounding measurement factor and thus tamper body composition values. A research made on 20 participants that were measured 3 times during the day showed the average error of estimation of 0,8%, although some participants showed much higher errors.
Physical activity and nutrition are factors that can lead to disproportions in estimated values. Albeit, if measurement is always made in the same conditions this method can show precise values. Some research point to BIA being almost as precise as DEXA, which is a gold standard. (8, 9, 10)
Disadvantage of BIA is lack of preciseness in estimating fat mass percentage in obese subjects.
Obese subjects have more body mass and body water in the trunk, hydration of fat free mass is lower in obese subjects and ratio of water found inside compared to outside of the cells is increased. (11, 12)
Figure 3. Bioelectrical impedance protocol (BIA)

Skinfold thickness measurement
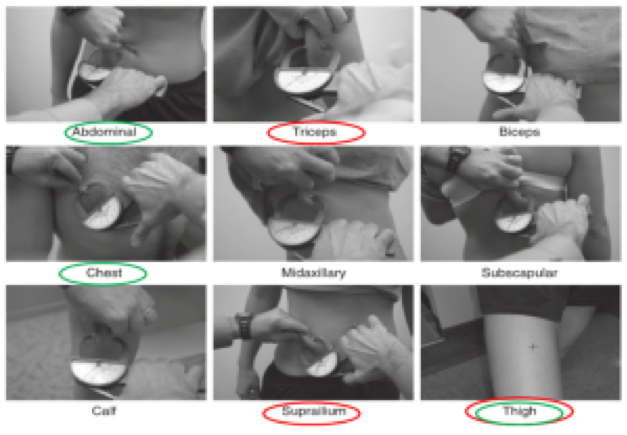
Method of skinfold thickness measurement is made using caliper. Obtained values are put into equation for estimating fat mass percentage. Equations vary depending on number of skinfold thickness measurements and most commonly used are those with 1,3,4 and skinfolds. The more skinfolds are taken the higher is precision of obtained results. Skinfolds usually taken are shown in Figure 4: subscapular, triceps brachii, chest, biceps brachii, midaxillary, calf, suprailiac, thigh and umbilicus.
Type of measurement in men that includes only 3 skinfolds is circled green and in women red.
Figure 4. Postions of taken skinfolds

When all skinfolds are taken their sum is used for determining the density by formula:
body density = 1,112 – (0,00043499 * sum of skinfolds) + (0,00000055 * sum of skinfolds2) – (0,00028826 * age))
After calculating body density, fat mass percentage should be calculated.
1 = (457/density) – 414,2
2 = (495/density) – 450
And your body fat percentage is calculated.
The advantages of using caliper are possibility for using it in different environments, time of the day (13) and short study period for mastering the procedure. Albeit it is hard to use it for measurements on subjects with high fat mass percentage. For getting the best results some steps should be followed:
- repeat each measurement at least twice
- to measure and mark position on measurements on the body surface
- do all measurements on the right side of the body
- keep the sweat off the skin during measurements
- hold the skinfold during the entire measurement
- Dana L. Duren, Richard J. Sherwood, Stefan A. Czerwinski , Miryoung Lee., Audrey C. Choh, Ph.D., Roger M. Siervogel. Wm. Cameron Chumlea. Body Composition Methods: Comparisons and Interpretation. J Diabetes Sci Technol. 2008 Nov; 2(6): 1139–1146.
- Wilmore, J.H., Buskirk, E.R., DiGirolamo, M., Lohman, T.G. (1986). Body composition: A round table. Physician and Sports Medicine, 14, 144-162.
- Mišigoj – Duraković, M. (2008). Kinantropologija. Faculty of Kinesiology, University of Zagreb
- National Institutes of Health. (1985). Health implications of obesity. Annals of Internal Medicine, 163, 1073-7.
- Esmat T. Measuring and Evaluating Body Composition, 2010.
- Jeukendrup, A., Gleeson, M. (2010) Sport Nutrition (2nd Edition). Human Kinetics, Champaign, IL.
- Chumlea WC, Guo S. Bioelectrical impedance and body composition: present status and future direction–reply. Nutr Rev. 1994;52:323–325
- Kamimura, M., Avesani, C., Cendoroglo, M., Canziani, M., Draibe, S., Cuppari, L. (2003). Comparison of skinfold thicknesses and bioelectrical impedance analysis with dual‐energy X‐ray absorptiometry for the assessment of body fat in patients on long‐term haemodialysis therapy. Nephrology Dialysis Transplantation, 18, 101-105.
- Lintsi, M., Kaarma, H., Kull, I. (2004). Comparison of hand-to-hand bioimpedance and anthropometry equations versus dual-energy X-ray absorptiometry for the assessment of body fat percentage in 17-18-year-old conscripts. Clinical physiology and functional imaging, 24, 85-90.
- Vasudev, S., Mohan, A., Mohan, D., Farooq, S., Raj, D., Mohan, V. (2004). Validation of body fat measurement by skinfolds and two bioelectric impedance methods with DEXA–the Chennai Urban Rural Epidemiology Study [CURES-3].
- Gray DS, Bray GA, Gemayel N, Kaplan K. Effect of obesity on bioelectrical impedance. Am J Clin Nutr. 1989;50(2):255–260. [PubMed]
- Chumlea WC. Body composition assessment of obesity. In: Bray GA, Ryan DH, editors. Overweight and the metabolic syndrome: from bench to bedside. New York: Springer; 2006. pp. 23–35.
- Grgić J. Vučetić V. Brborović H. Variations in metabolism and body composition estimates throughout a day. Journal of Fitness Research. 2016


